
What is Business Growth & Revenue Intelligence?
Business Intelligence is the foundation the rest of the Intelligence Platform sits on. It’s where every media, first-party, and third-party data source a client has gets pulled into one place — instead of living in seven different logins across seven different partners.
Business Intelligence turns scattered data into a single, trusted source clients can actually make decisions from.
Behind the scenes, before a single chart ever renders, the platform maps, structures, and cleans every input so nothing downstream — reporting, MMM, CPA, any of it — is built on data no one’s checked.
How It Works & How to Use It
Business Intelligence connects directly to a client’s data ecosystem, then does the invisible work of making it trustworthy before it ever reaches a dashboard.
Unified Data Ingestion: Media platforms, first-party CRM or POS data, and third-party sources are connected into one pipeline instead of reviewed one login at a time.
Mapping & Structuring: Every source gets mapped to a common data model so a client’s media spend, sales data, and campaign metrics can actually be compared to each other, not just sit side by side.
Cleaning & Validation: Before anything hits a dashboard, the data is checked, de-duplicated, and standardized — this is the step that makes every number downstream defensible.
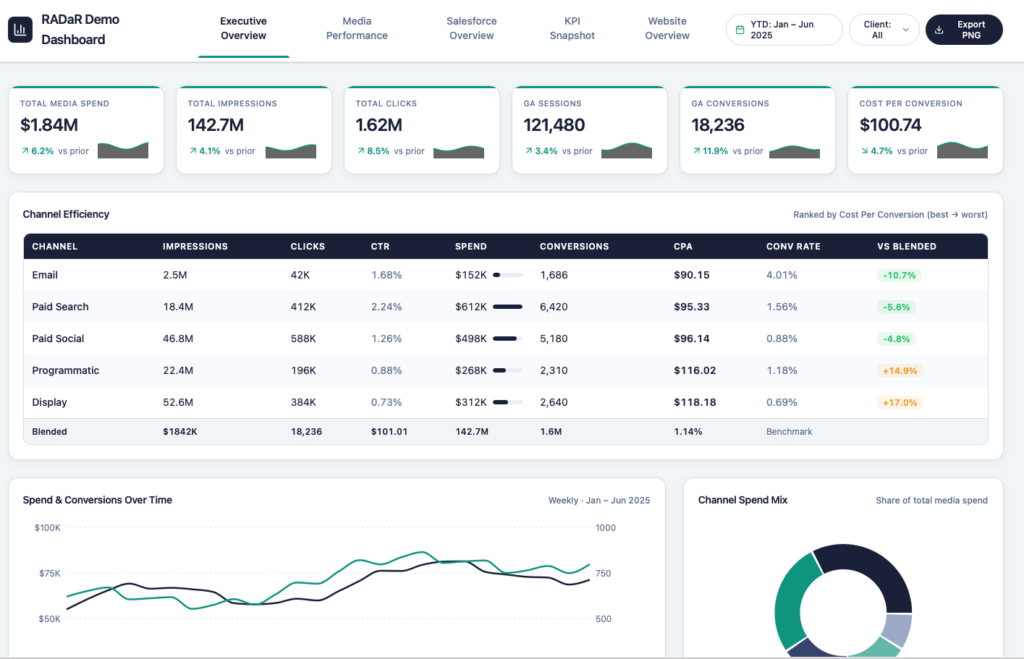
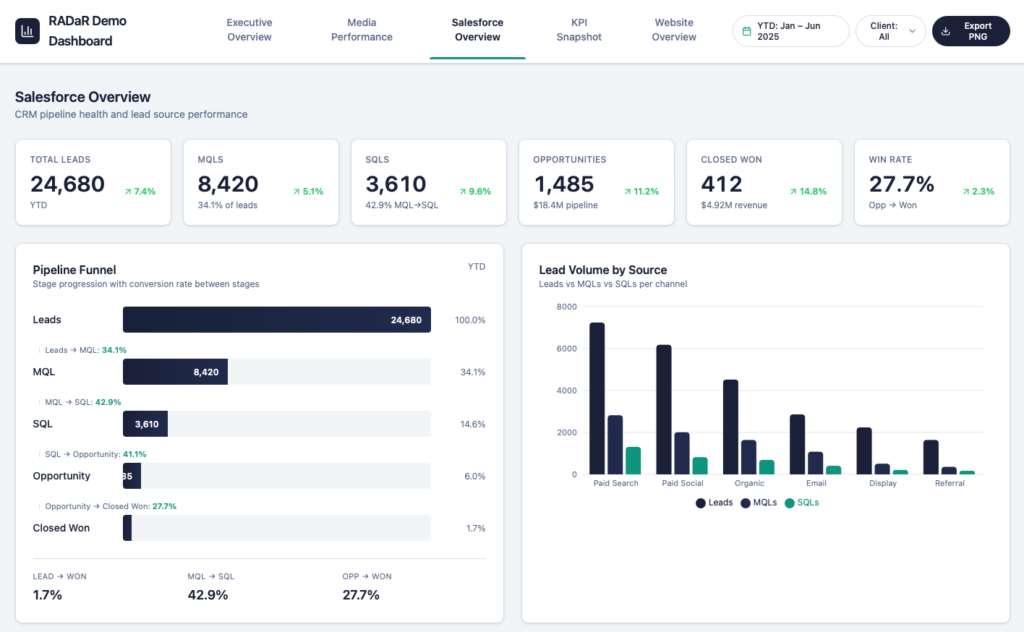
Connected Dashboards: Once the foundation is clean, it surfaces as reporting that ties marketing investment directly to business outcomes, built per engagement.
Key Findings and Insights
- Single Source of Truth: Replace five disconnected exports with one dashboard everyone — client and agency — is looking at and trusting.
- Investment-to-Outcome Visibility: See how media spend actually connects to the business result it was meant to drive, not just channel-level metrics.
- Data Quality You Can Point To: Because the mapping and cleaning happens before reporting, there’s a clear answer any time a client asks “where did this number come from?”
- Cross-Source Comparison: Put first-party sales data next to third-party media data next to campaign performance, in the same view, for the first time.
What Do I Do Once I Have Access to BI?
Executive & Client Reporting
- Give clients one dashboard that ties spend to outcomes, instead of a stitched-together deck built the night before a QBR.
Cross-Channel Budget Planning
- Use the unified view to see where dollars are working across channels before the next planning cycle, instead of guessing from separate reports.
New Business Pitches
- Show a prospect what a connected data foundation actually looks like — this is the proof point for "we start with data."
Ongoing Performance Monitoring
- Keep a live pulse on an account between formal reporting cycles instead of waiting for the next scheduled pull.
When Should I Use BI?
Client Onboarding
Establish the master data table and connections on day one of an engagement
Executive Reporting
Give leadership one place to see performance across every channel
QBR Prep
Walk into a client review with a live dashboard instead of a static deck
New Business Pitches
Demonstrate a connected data foundation before a client signs
Budget Planning
Compare channel performance side-by-side before reallocating spend
Data Quality Checks
Confirm sources are mapped and clean before any other tool runs on top of them
Cross Agency Alignment
Give every agency touching an account the same numbers to work from
Historical Trend Analysis
Look at performance over time across sources that used to live separately
Feeding Other Tools
Serve as the clean data layer that MMM, CPA, and MTA all build on.
Ready To Get Started?
Contact the RADaR Analytics team at [email protected]
Latest blog posts about BI
-
We Built a Brain for Your Campaign Data. Meet your Campaign Performance Assistant (CPA).
UPDATE: September 9, 2026 CPA is now available to all MTP employees. Updates and improvements since our initial release include: Campaign Performance Assistant by Meet The People Dark banner with grid background, funnel ring motif on the left, and connected data nodes on the right Campaign Performance Assistant BY MEET THE PEOPLE Your clients’ marketing… -
Campaign Performance Analyst Architecture Update
The Campaign Performance Analyst (CPA) project at RADaR has shifted from standard AWS/Snowflake tools to a custom Python architecture featuring proprietary custom AI agents and Anthropic’s Model Context Protocol (MCP) Server. This overhaul significantly improved flexibility and cut query response times from two minutes to under 20 seconds. -
Campaign Intelligence Technical Architecture Research
As we move into development of our latest tool, Campaign Intelligence, we need to take a look at the high-level architecture and available resources before moving forward. This document serves as a reference for the research we did, the benefits and drawbacks of using specific integrations for our product, and the reasoning behind any decisions…